Search for...
Infographics Bookmarks
Published Bookmarks

A complete step-by-step guide for beginners on how to create professional and engaging infographics for both print and online use. Includes visual guides for how to choose the right type of infographic, how to select icons and fonts, among other practical tips.


How and why can L&D embrace the fact that we learn from work? What can be done to burst the ‘training bubble’ where formal learning is delivered as an event, separate to the workflow? An infographic primer exploring these key questions.
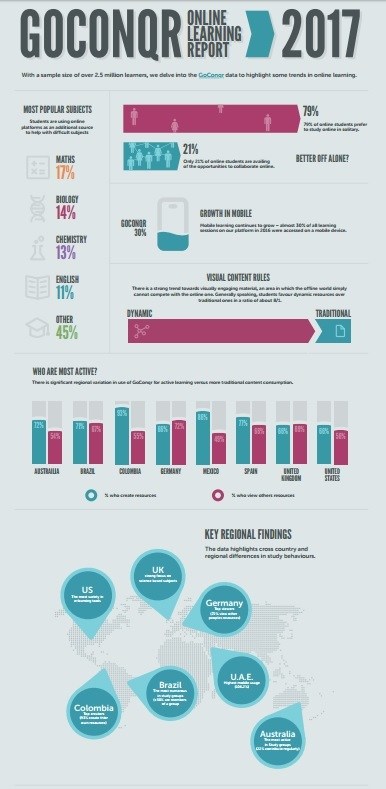
The GoConqr Online Learning Report 2017 aims to understand the impact of digital tools on teaching and learning. Learn more about how students learn online
Data visualisation software is an excellent way to manage, present and make sense of complex business data. There are a ton of great tools out there that’ll help you prepare, analyse and visualise it all – and they’re suited for a variety of industries and uses

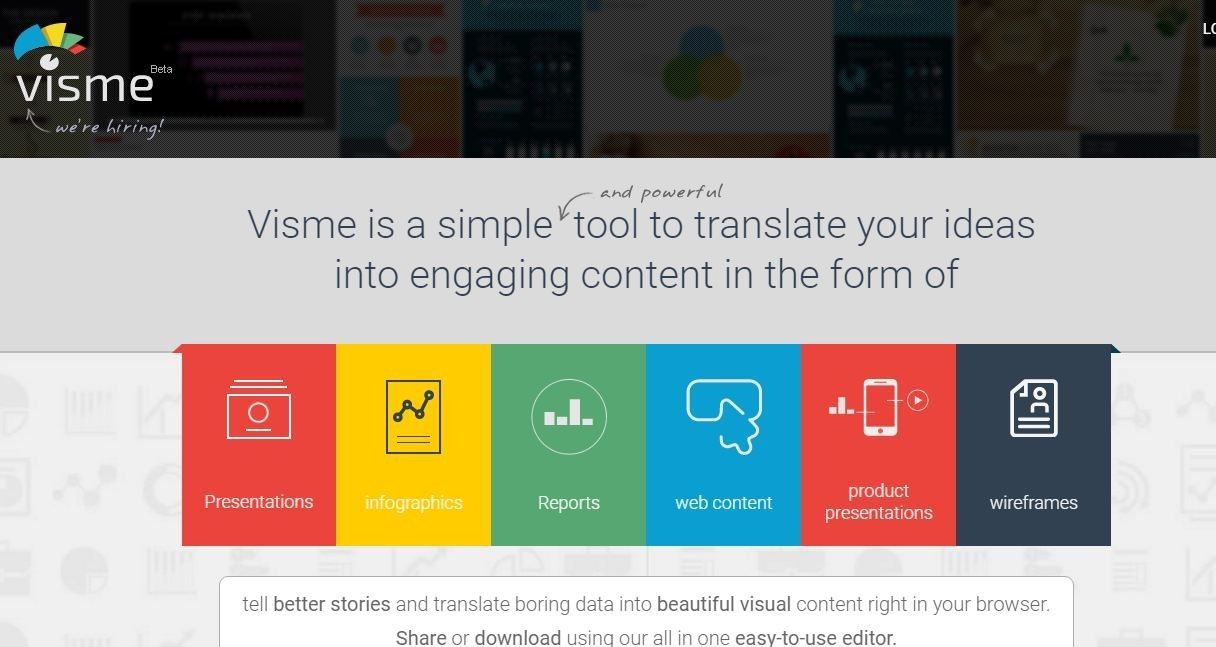
The biggest value proposition for us was drag and drop HTML5 design with no coding needed. That benefit alone made this platform worth reviewing.
Check out the below listed Top 10 Most Popular Best Free Online Infographic Maker Websites 2017, If you’re looking for an infographics maker of choice, try a few tools to see which one suits your style and type of content you have
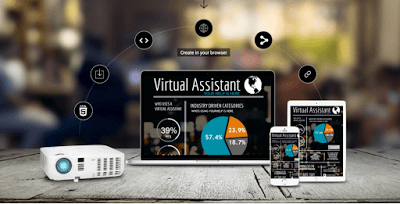
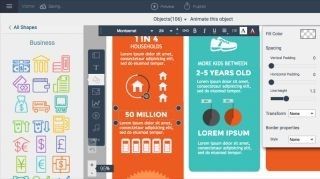
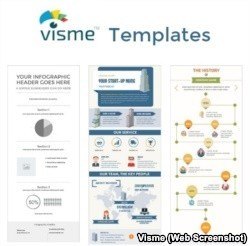
The popular Visme has recently introduced a number of interesting features that make it even much more easier to create professionally looking infographics and presentations without the need for any design knowledge.

Emerging and evolving social media learning gives organisations opportunities to transform learning in a contemporary way.
Educators and students are using this to improve communication on various topics. Users can start from a preset of professional templates or start from a blank canvas and create their own content, fully personalized to their specific needs.
You can use infographics on social media, in presentations or just for fun. They can help people understand complex ideas or plans.
Upcoming Infographics
Bookmarks All
Bookmarks All


Submit Bookmark