Search for...
Authoring Tools Bookmarks
Published Bookmarks

Planning for Flash to HTML5 migration? Read this article for 5 steps you shouldn’t miss during Flash to HTML5 migration.

Learn how to easily turn PowerPoint graphics into SVG files for use in Storyline and Storyline 360. eLearning developers will love this quick and easy hack.
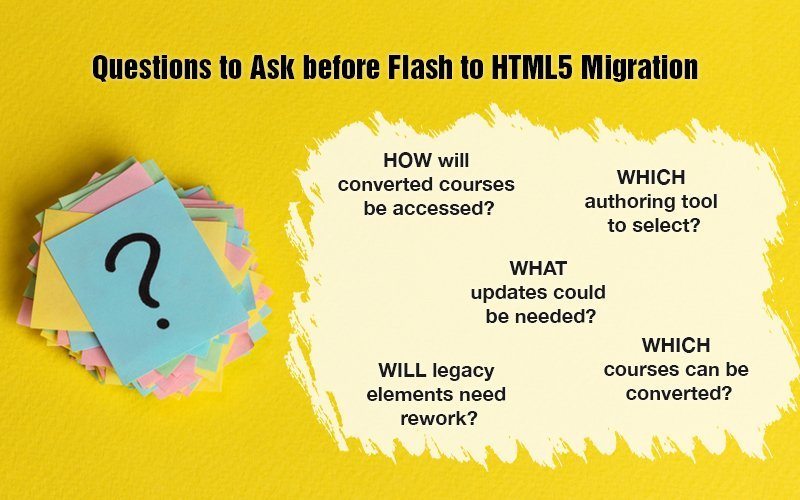
Want to successfully migrate Flash eLearning courses to HTML5? Find answers to the most important questions about Flash to HTML5 conversion.
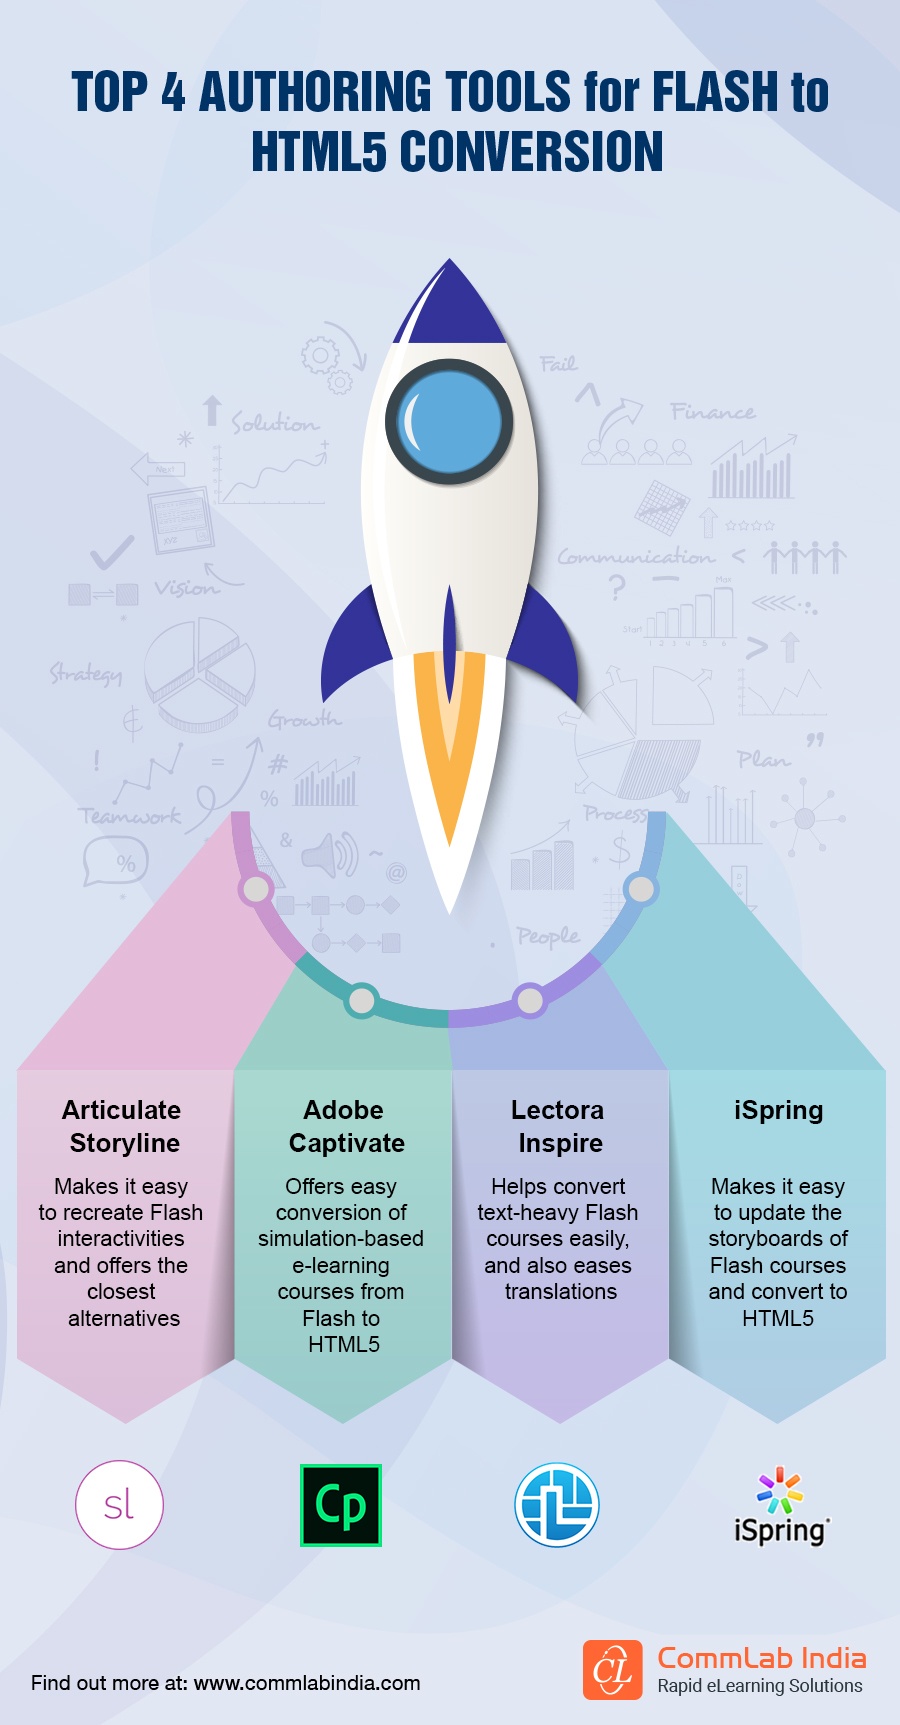
With many authoring tools available, how do you select one for Flash to HTML5 conversion? Take a sneak peek at the top tools for Flash to HTML5 conversion.
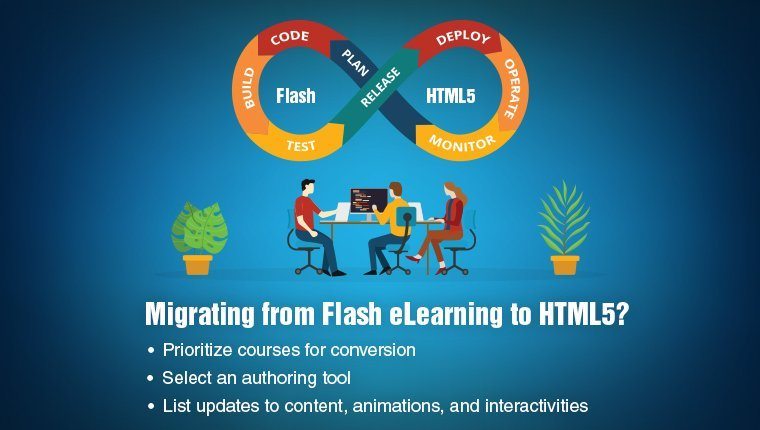
If Flash to HTML5 migration of eLearning courses is what you’re looking for, think about these 5 points before you migrate Flash eLearning to HTML5.

Organizations ought to convert Flash to HTML5 to salvage their legacy courses. This article answers 5 pertinent questions on converting Flash to HTML5.
Do you know these tips to save costs in Flash to HTML5 conversion? Check this article to complete Flash to HTML5 conversion on a budget.
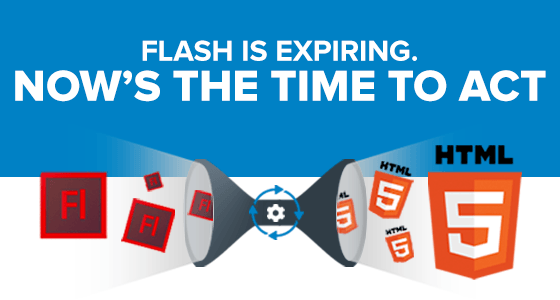

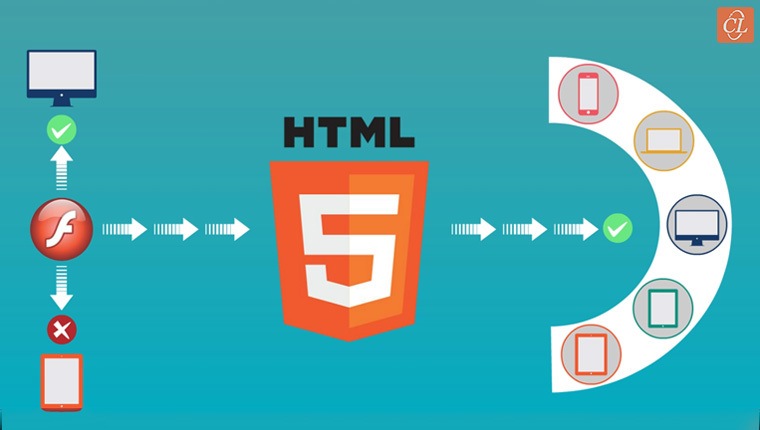
For many larger organizations, managing the Flash-to-HTML migration will take time, which means the process of converting your relevant Flash-based eLearning courses should begin immediately. Organizations that fail to do so risk losing their content forever.

By converting your Flash content to HTML5, you can prevent your content from becoming obsolete. Additionally, creating responsive content via HTML5 provides your audience or customers with a more engaging experience than ever before.
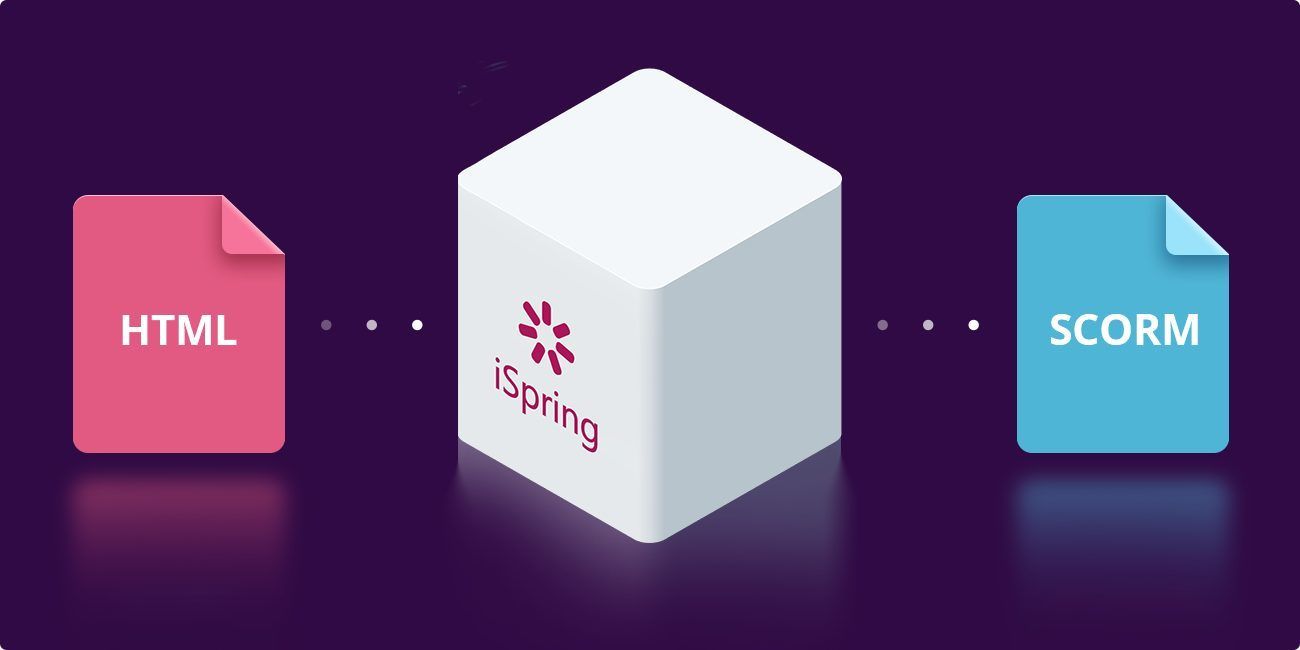

Learn how to make your HTML files SCORM compliant so that you can upload your courses to an LMS. Tips and tricks, automatic and manual ways, and workarounds.
Upcoming Authoring Tools
Bookmarks All
Bookmarks All

Submit Bookmark