Search for...
Infographics Bookmarks
Published Bookmarks

Want your eLearning courses to stand the test of time? Learn how to future-proof eLearning courses through this infographic.
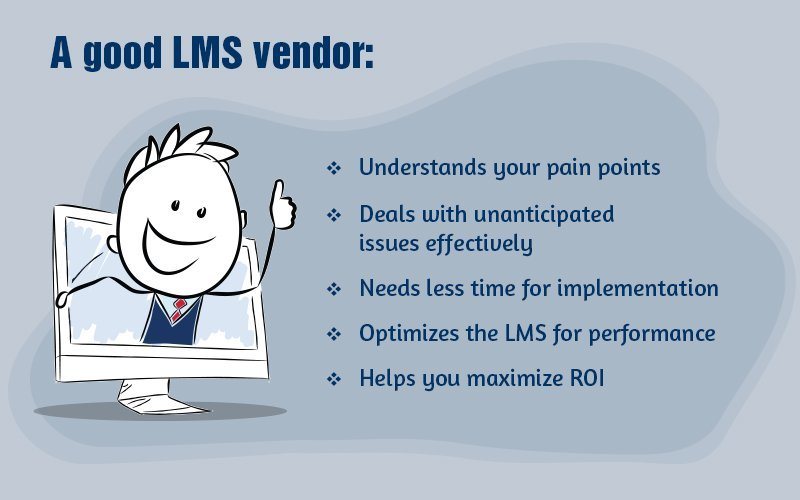
Choose an experienced vendor for your LMS. If you are wondering why, here’s an infographic on 5 reasons you need to choose an experienced LMS vendor.
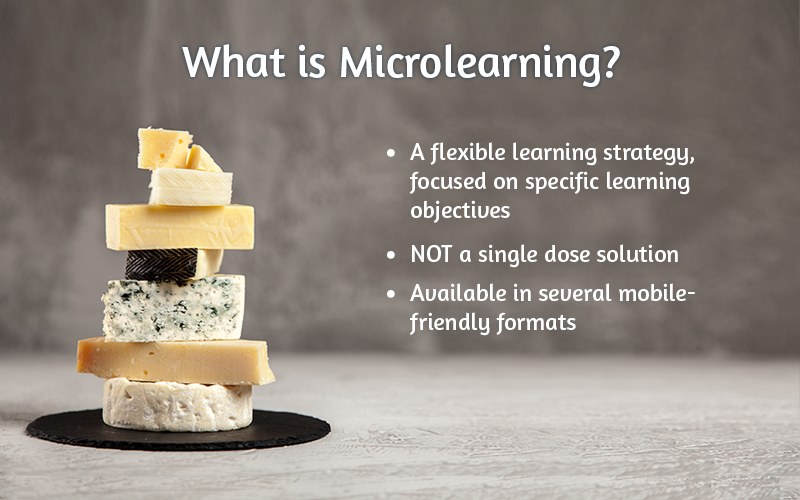
Microlearning helps you and your learners with various benefits. Learn the benefits of having microlearning in your learning strategy.
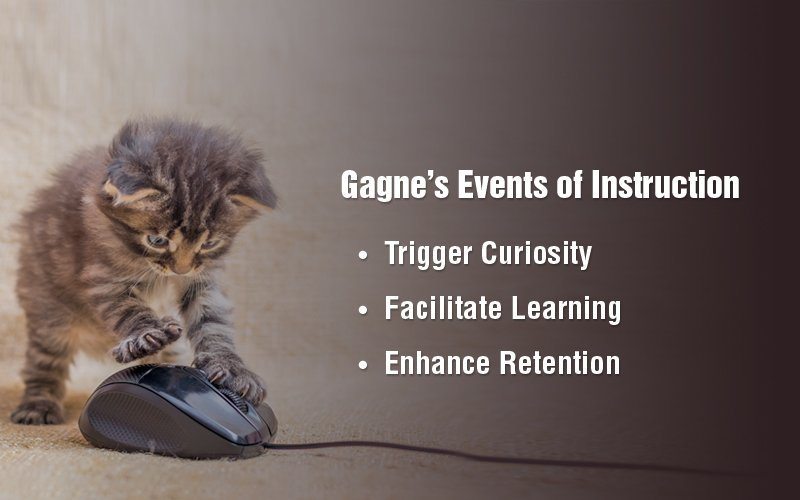
To make your eLearning courses more effective, adopt Gagne’s events of instruction. Take a look at Gagne’s 9 events of instruction, in this infographic.
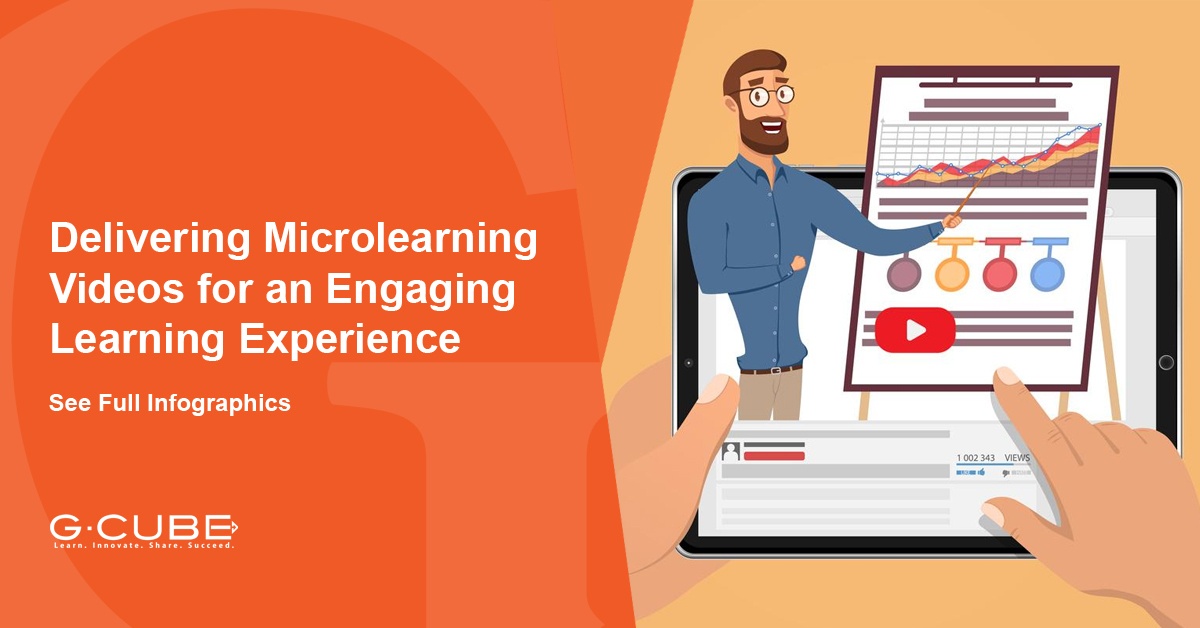

Custom micro-content delivery incorporates engaging videos to drive retention, boost engagement, and hence higher ROI.
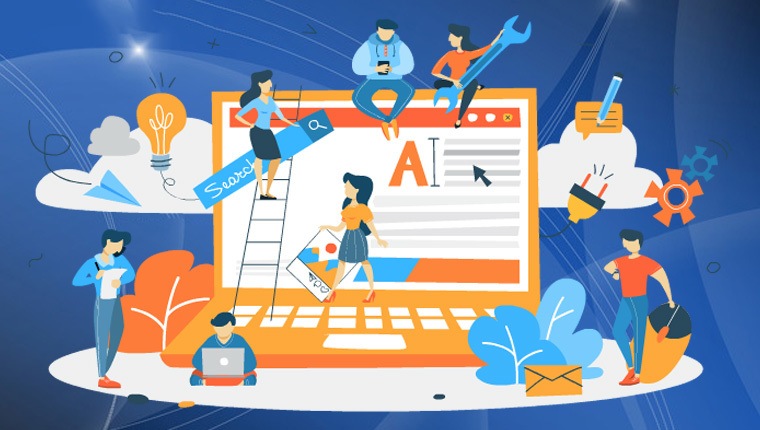
Designing an effective online learning experience is no easy task. Here’s an infographic on the must-have elements that make online learning effective.
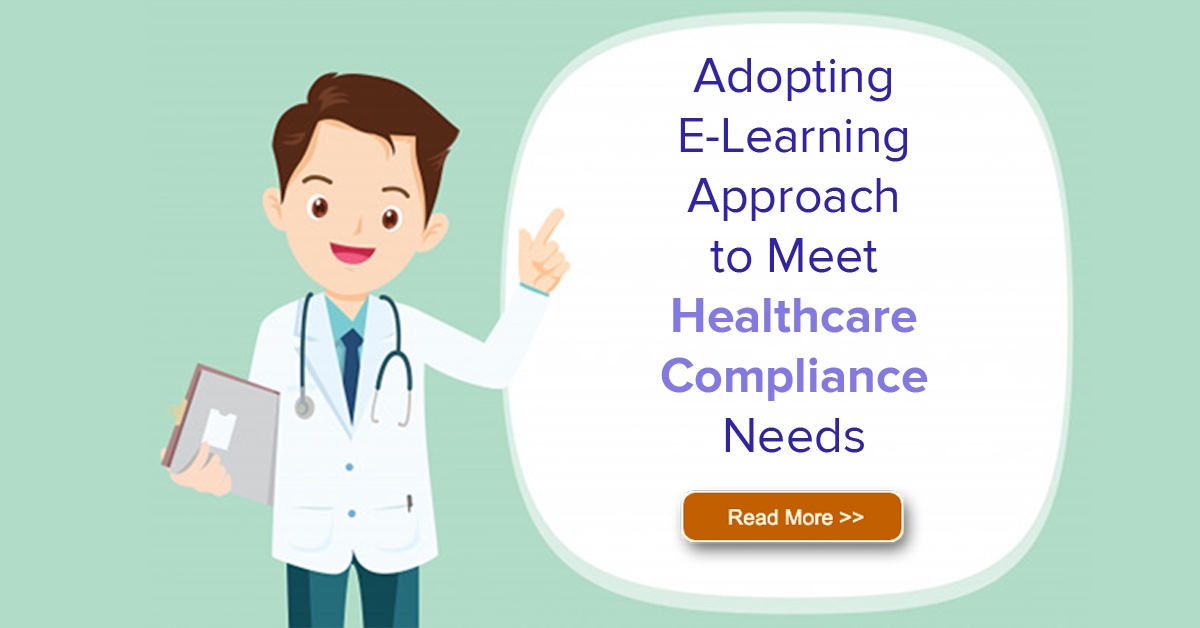
Several benefits of eLearning for healthcare include seamless mobile support, periodic assessment, skill-gap analysis, automated tracking, reporting, and more.
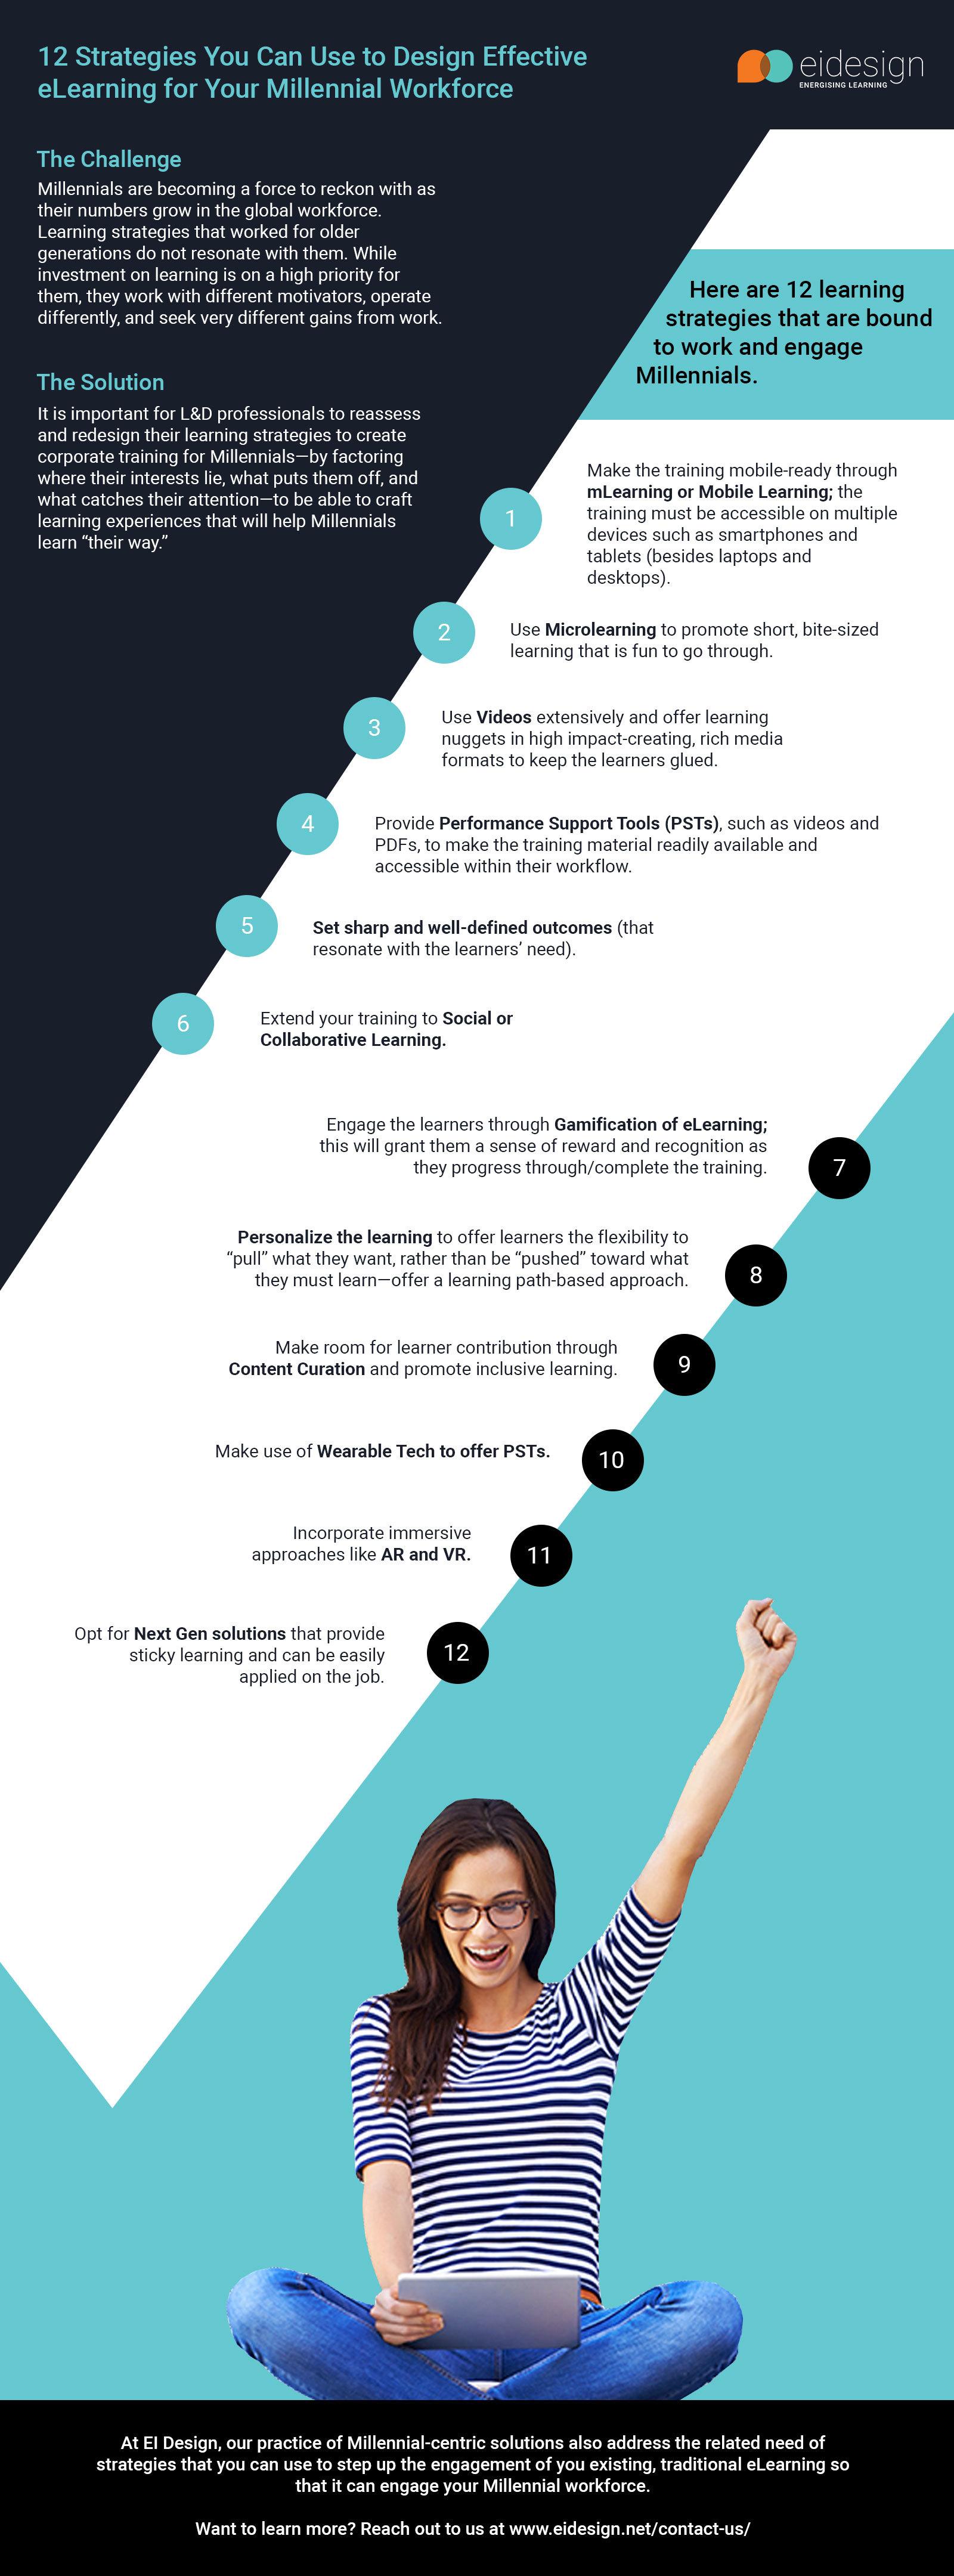

Here are 12 strategies you can use to design effective eLearning for your millennial workforce.
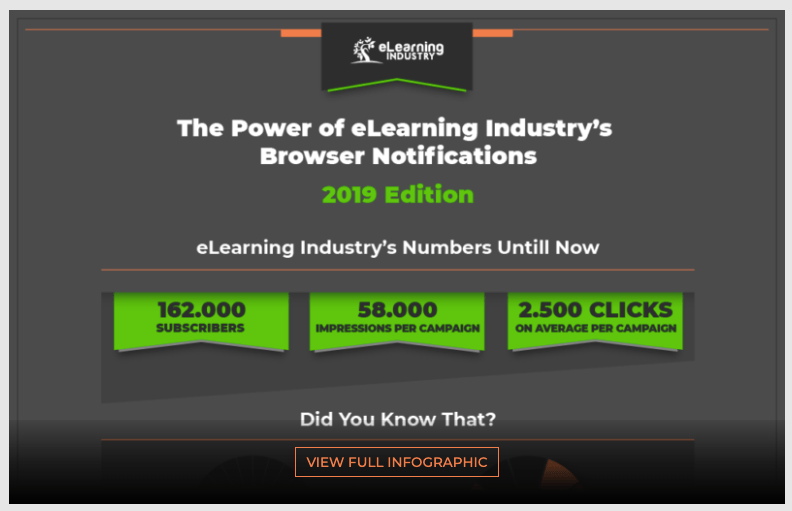

Check The Power of eLearning Industry Browser Notifications Infographic 2019 Edition! Browser Notifications are one of the hottest marketing channels!
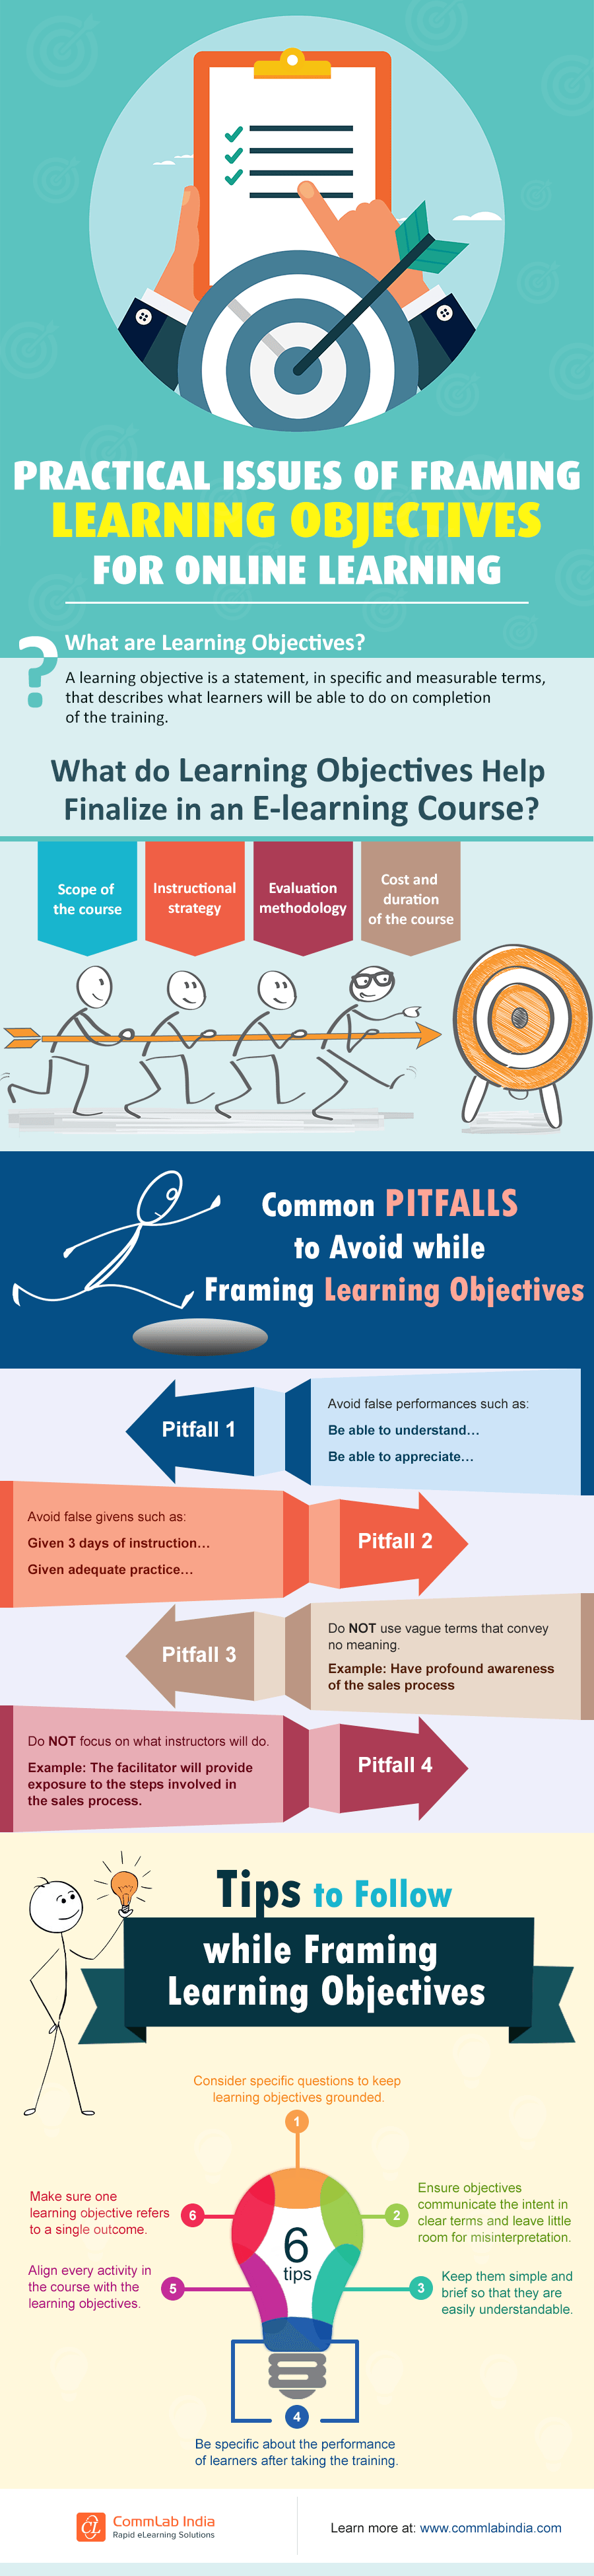
This infographic will give an overview of learning objectives, their importance in online learning, and the pitfalls to avoid and tips to be considered when framing effective e-learning objectives.
Upcoming Infographics
Bookmarks All
Bookmarks All


Submit Bookmark