Search for...
#infographic Bookmarks
Published Bookmarks
 How to Design Your Educational Infographics
Creating an infographic to educate more people about a certain topic?
Well here's everything you need to know from what colors to use and down to how to frame your infographic.
Well here's everything you need to know from what colors to use and down to how to frame your infographic.
 How To Create Beautiful Visuals On Your Own
Video tutorials and expert tips on turning boring information into beautiful visuals. Learn here!
 9 Steps to Follow Before You Create Your Infographic
steps to follow when creating your infographic which is to establishing the ground work for the design and population of your infographic. This will help you save time and frustration in creating your final infographic.
 What Types of Infographic To Use
Here are the 13 different types of infographics and which one works best for your content and data format.
 What Makes a Good Infographic Explained
Let's dive into Infographics which when created properly act as powerful visual communication assets to make sense of otherwise hard to understand data, stats and figures.
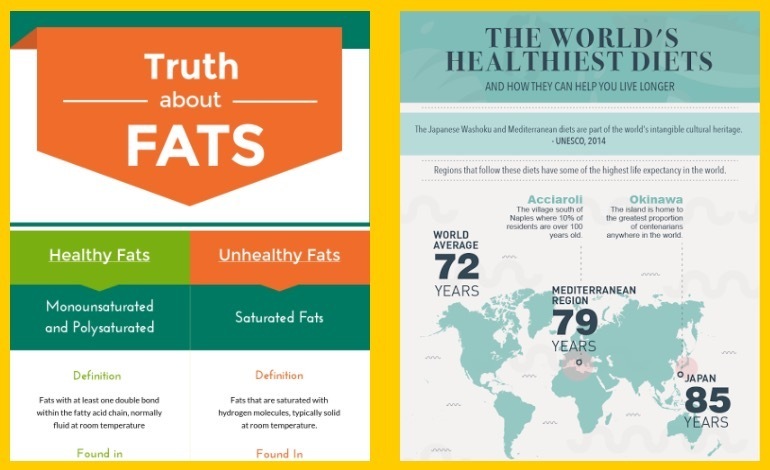 Infographic Design 101 for Health professionals
The first step towards telling a good health story is to have credible health care data to back up your claims. Luckily, the internet is a goldmine of open health data waiting for you to explore.
 Why We Love Visme at DevriX
Data itself is a boring word, really! Having said that, we can’t ignore the importance of it, no matter what field of life it is. For the business world, data is important for making strategies, setting goals and making important business decisions.
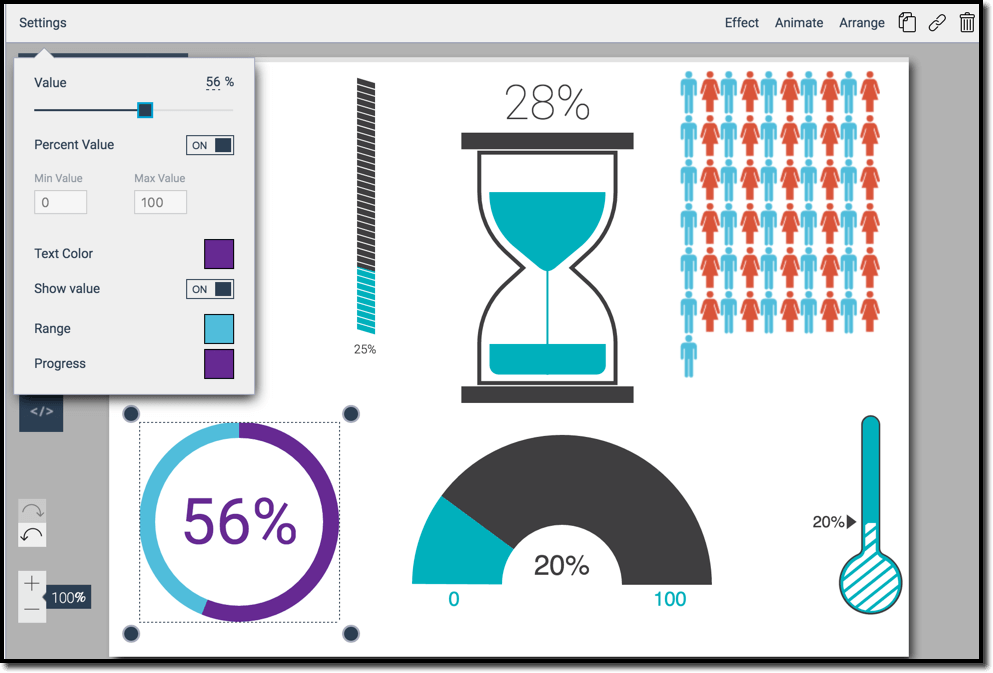 Create Infographics and Presentations Like a Pro with Visme
Create infographics and presentations that rock! Effectively visualize data with features like interactive maps and beautiful charts / graphs.
 Visme – Create Awesome Educational Visuals!
I have used many online tools for content creation: Canva, Prezi, Blendspace by TES, the G Suite Apps, EdPuzzle - just to name a few.
 How To Design Your Own Visual Resume
Design Your Own Visual Resume visualcv online cv builder and professional resume cv maker infographic design work with world class designers to create infographics that stand out we make it fast easy and affordable starts at 3000 usd Design Your Own Visual Resume
Submit Bookmark

