Search for...
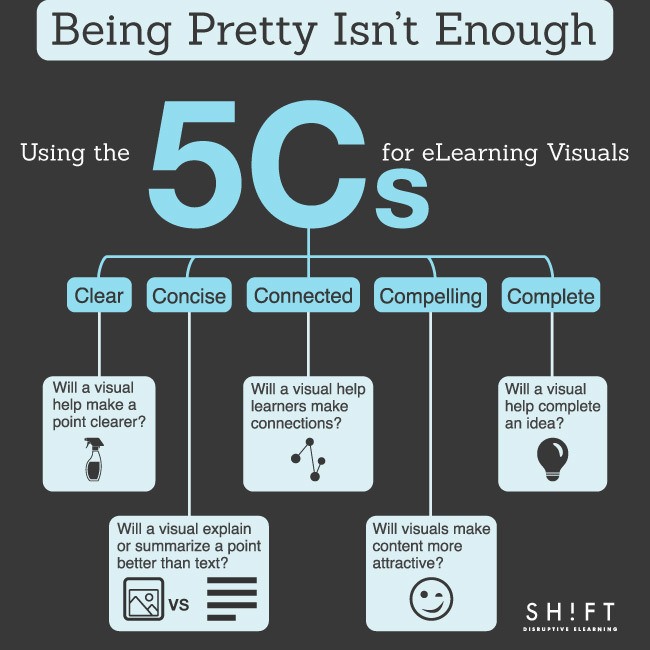
Being Pretty Isn’t Enough: Using the 5 Cs for eLearning Visuals
Although infographics, charts, illustrations, and other visuals for eLearning will never replace quality content, they can often do a better job at explaining content easily. However, in order to become effective teaching tools, visuals must reflect the user’s cognitive architecture and add something meaningful to the learning experience.
This post looks at a simple approach to creating effective visuals for eLearning by considering the 5 Cs.


You can adjust your cookie preferences here.