We use cookies in order to personalize your experience, display relevant advertising, offer social media sharing capabilities and analyze our website's performance.
Read all about it in our cookie policy.
Cookie Preferences
eLearning Tags
  • Published Bookmarks
  • Upcoming Bookmarks
  • Categories
    • eLearning
    • LMS
    • Authoring Tools
    • Events
    • Gamification
    • Infographics
    • Instructional Design
    • Jobs
    • Microlearning
    • Mobile Learning
    • MOOC
    • Other
    • Press Releases
    • Social Learning
Search for...

bellegit
April 25, 2017 | Infographics
by bellegit
Create Infographics and Presentations Like a Pro with Visme

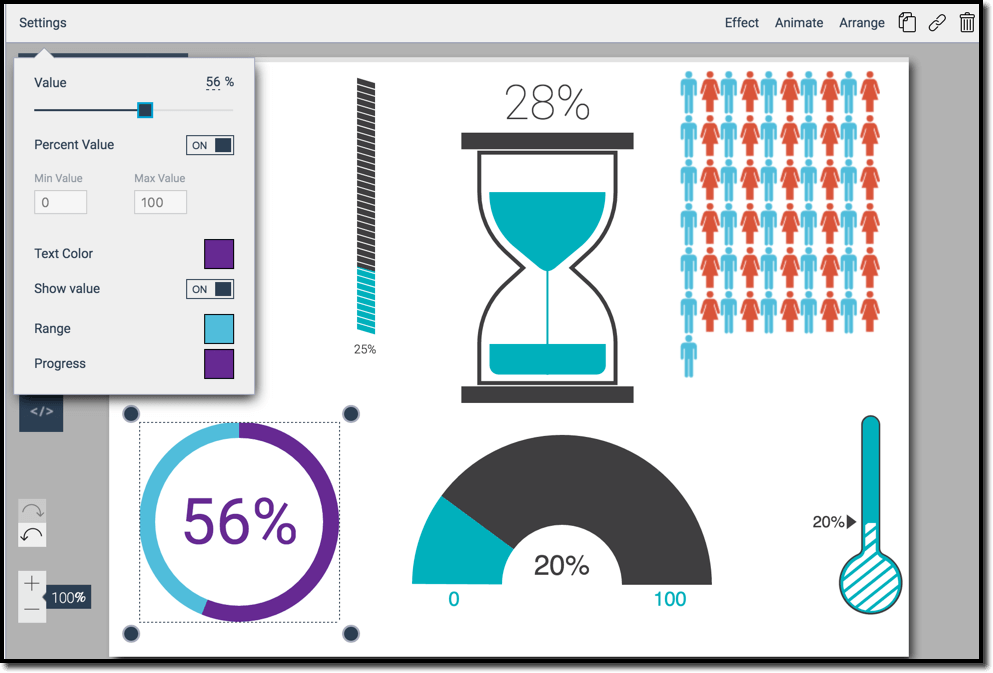
Create infographics and presentations that rock! Effectively visualize data with features like interactive maps and beautiful charts / graphs.

Source Link: http://edtechpicks.org/2017/04/create-infographics-and-presentations-like-a-pro-with-visme/?utm_content=buffer69cd1&utm_medium=social&utm_source=twitter.com&utm_campaign=buffer#EdTech
Tags: #Educational Technology #infographic #instructional design
Create Infographics and Presentations Like a Pro with Visme thumbnail
Vote
1
3 Votes
Please sign in to vote this bookmark.
Like 1 Like
Please sign in to like this bookmark.
Comment

Comments

In order write a comment you need to have functionality cookies enabled.
You can adjust your cookie preferences here.
Submit a Bookmark
Submit Link Here
Popular Tags
#e-learning #e-learning development #Educational Technology #instructional design #elearning #learning management system #Gamification #authoring tools #Online Training #mobile learning #Corporate Training #lms #online education #training #templates #Social Learning #Corporate eLearning Best Practices #infographic #edtech #Employee Training
eLearning Tags
    • Published Bookmarks
    • Upcoming Bookmarks
    • Terms of Service
    • Privacy Policy
    • Cookie Policy
    • About
    • Contact
© 2025 eLearning Tags.