Search for...

The PISA 2012 Results Infographic | e-Learning Infographics
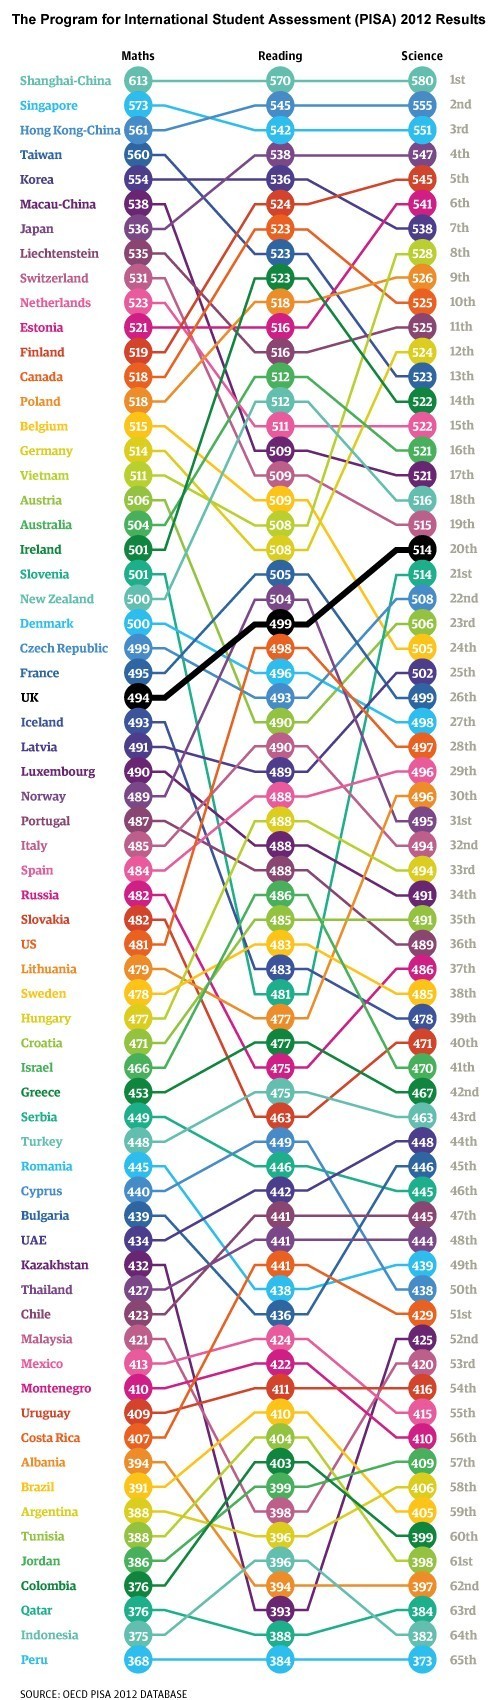
How OECD countries scored at the PISA’s 2012 results? How does your country compare for reading, maths, and science?
You can adjust your cookie preferences here.